Difference between revisions of "SimplePop"
Jump to navigation
Jump to search
| (2 intermediate revisions by the same user not shown) | |||
| Line 1: | Line 1: | ||
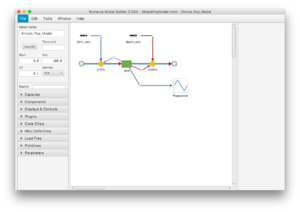
[[File:simplepop.png|thumb|Simple Population Model: Design Frame]] | [[File:simplepop.png|thumb|Simple Population Model: Design Frame]] | ||
[[File:simplepoprun.png|thumb|Simple Population Model: Runtime Frame]] | [[File:simplepoprun.png|thumb|Simple Population Model: Runtime Frame]] | ||
This very simple model demonstrate the basic features of stocks and flows. The | This very simple model demonstrate the basic features of stocks and flows. | ||
The Design Frame shows a Stock with incoming and outgoing Flows. The equations in the Flows ''births'' and ''deaths'' are evaluated at each time step and add (respectively subtracts) their value to the value of the Stock ''pop'', which keeps a running tally of total population. These Flows use value provided by the sliders ''birth_rate'' and ''death_rate'', respectively, multiplying them by the current value of ''pop''. The graph ''Population'' displays the value of ''pop'' at each time step. | |||
The Runtime Frame presents a dashboard containing the two sliders and the graph. The simulation is run using the controls in the top toolbar. | |||
Latest revision as of 21:19, 29 January 2018
This very simple model demonstrate the basic features of stocks and flows.
The Design Frame shows a Stock with incoming and outgoing Flows. The equations in the Flows births and deaths are evaluated at each time step and add (respectively subtracts) their value to the value of the Stock pop, which keeps a running tally of total population. These Flows use value provided by the sliders birth_rate and death_rate, respectively, multiplying them by the current value of pop. The graph Population displays the value of pop at each time step.
The Runtime Frame presents a dashboard containing the two sliders and the graph. The simulation is run using the controls in the top toolbar.

