Difference between revisions of "NMB DASA Covid-19 User Guide"
| (One intermediate revision by the same user not shown) | |||
| Line 78: | Line 78: | ||
Data files must have one of the formats illustrated below. The second example indicates a start date of March 5, 2020.<br> | Data files must have one of the formats illustrated below. The second example indicates a start date of March 5, 2020.<br> | ||
{| | {| | ||
|[[File:fig5.png| | |[[File:fig5.png|280px]] | ||
|style="vertical-align: top; padding-left:10px;"| | |style="vertical-align: top; padding-left:10px;"| | ||
<pre>58,78,72,94,147,185,234,239,573,335,466,... | <pre>58,78,72,94,147,185,234,239,573,335,466,... | ||
0,0,0,4,1,5,4,8,2,21,27,28,41,49,36,133,...</pre> | 0,0,0,4,1,5,4,8,2,21,27,28,41,49,36,133,...</pre> | ||
|- | |- | ||
|[[File:fig5a.png| | |[[File:fig5a.png|280px]] | ||
|style="vertical-align: top; padding-left:10px;"| | |style="vertical-align: top; padding-left:10px;"| | ||
<pre>2020,3,5 | <pre>2020,3,5 | ||
Latest revision as of 20:53, 4 October 2020
Overview
This WebApp contains a new extended SEIR model and simulation engine for tracking the progress of instances and mortality in the Covid-19 pandemic, based on a set of 20 model parameter inputs. The model and simulation are used to fit sample data and subsequently facilitate forecasting under various conditions.
The user creates a project by:
- Providing some initial settings for model inputs (default settings are available); and
- Uploading a CSV file containing sequences of incidence and mortality data over some span of days.
Model data are retained by the WebApp for use on all pages. Data will be retained even if the WebApp is reloaded. Model input settings are first tuned by fitting the simulation to the sample curves up to any point in their length. Forecasting with various scenarios can start at any point of fitting interval of the sample sequence. Forecasting begins with the model initialized to the state determined by the fit.
During forecasting two sets of data are used:
- Optimization Settings (shown in green) are the results of performing the data fit and are used until a selected Forecast Onset point, chosen in the range of the fit, to initialize the state of the model to the state obtained by the fit. Optimization settings also appear on the settings page.
- Forecast Settings (shown in red) kick in at the Forecast Onset and may include changes in slider values and switch positions. In particular, enabling the Deterministic/Stochastic switch introduces randomness into the simulation during the forecast.
An MCMC Metropolis-Hastings algorithm implementation page produces MCMC distributions for selected parameters. These can be used to select new parameter values for use from the point of Forecast Onset
The Model
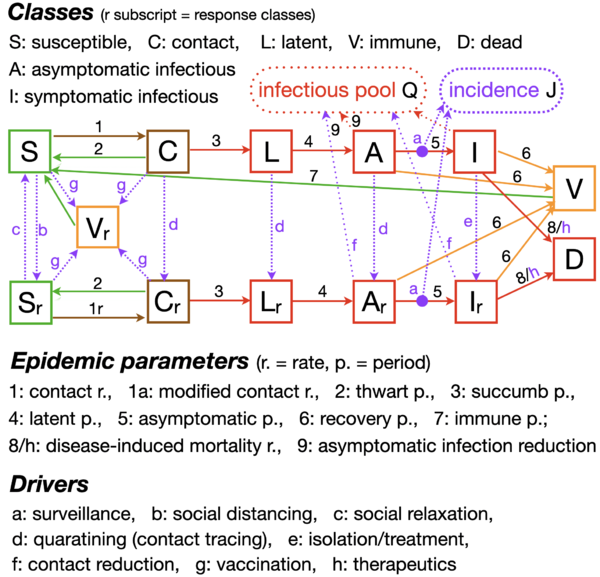
A schematic of the model is shown below. Note that it has an expanded number of classes and divides its inputs into Epidemic Parameters and Drivers.
Model inputs are organized into two groups:
- Epidemic Parameters: These are fixed at the beginning of the simulation or at the beginning of a forecast run.
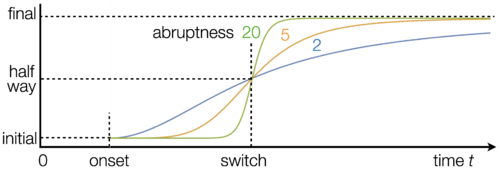
- Drivers: These are either fixed like the parameters or, if "switched-on" will follow a logistic "ramping up" pattern at a given switch time and with a given slope.
Further details of the model can be found in W. M. Getz, R. Salter, L. Luisa-Vissat, N. Horvitz, A Versatile Web App for Identifying the Drivers of COVID-19 Epidemics, which can be viewed here
WebApp Organization
The site is organized into these pages:
- The Settings Page: Create, save, load and edit a project pairing sample data with initial model inputs.
- The Optimization Page: Select model inputs to vary and perform a Nelder-Mead optimization using an MLE error calculation to fit the data.
- The MCMC Page: Create parameter distributions using the method of Markov chain Monte Carlo (MCMC) for stochastic forecasting.
- The Forecast Page: Investigate various future scenarios using the MCMC distribution created above and by changing model inputs with the model tuned according to the optimization.
Important: the WebApp maintains a single database of inputs and other settings. Changes made on any page after initial settings are recorded are propagated to all pages.
Settings Page
Model Settings
Model settings are entered into three tables:
- Epidemic Parameters: Enter 3 values for each: minimum, preferred, maximum.
- Drivers: Entries in this table define the location and shape of the logistic onset for each driver.
- Switches on the optimization and forecast page determine the choice of driver values.
- Pre-onset values are used throughout if the driver is not "switched on".
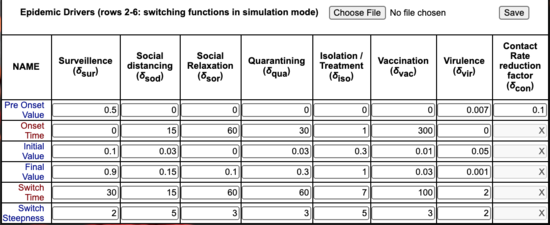
The Epidemic and Driver values entered when the project is being set up are stored as both Optimization and Forecast
settings. Later this page can be used to view the changes between these parameter sets by clicking the "Optimization Settings" or "Forecast Settings" radio buttons.
- Timing Settings
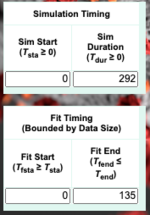
- Simulation start/duration: Simulations start is with respect to the start of the data. Duration may exceed the length of the data.
- Fitting interval [Tfsta, Tfend] on which optimization will take place. It must be a sub-interval of the both simulation and data range.
Note: These settings can be overridden on subsequent pages.
Data Input
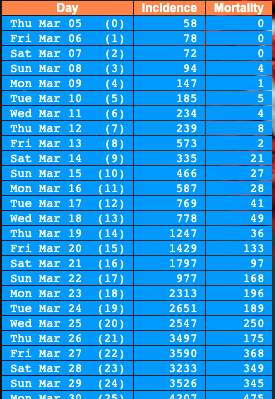
Data is contained in CSV files with two lines containing, respectively, sequences of incidence and mortality values. Lines should have the same length and entries in each line represent corresponding dates. An optional top line may be included with 3 values numerically indicating the year, month and day of the start of the data.
Data files must have one of the formats illustrated below. The second example indicates a start date of March 5, 2020.

|
58,78,72,94,147,185,234,239,573,335,466,... 0,0,0,4,1,5,4,8,2,21,27,28,41,49,36,133,... |
|
2020,3,5 58,78,72,94,147,185,234,239,573,335,466,... 0,0,0,4,1,5,4,8,2,21,27,28,41,49,36,133,... |
Saving Settings
- Settings can be downloaded and reloaded for later reference.
- Entries in the Epidemic Parameters and Drivers can also be saved for use with different data sets in other projects.
Optimization
This page is used to fit the model to incidence and mortality data loaded into the project on the settings page.
The initial values of the inputs are set to the values entered on the settings page. We use Nelder-Mead optimization with an MLE error calculation to fit the data curve. To use the optimizer please follow these steps:
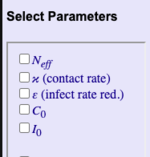
- Select the parameters in the left-hand column that will be allowed to vary during the optimization.
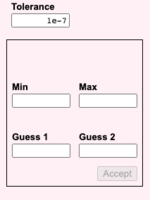
- Tolerance, Min, Max, Guess 1, and Guess 2 refer to Nelder-Mead parameterization. (Click here for further details regarding the Nelder-Mead algorithm.)
- Default values will appear when a parameter is selected and may be overridden.
- The optimization interval is determined by the Fit Range.
- Optimizations may be started/stopped and continued using the appropriate buttons.
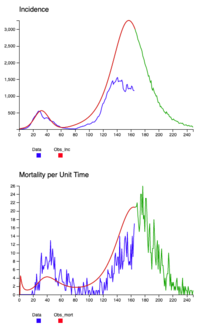
- Clicking run when the optimization is stopped will show the progress of the optimization by graphing both the data points and the simulation. When an optimization is stopped or completed, the endpoint of runs used to display the simulation and is given by Simulation End and initially determined by Tfin from the settings page. Simulation End is ignored during optimization, replaced by Fit Range. When the optimization is complete the model will run once showing the fit.
- Clicking Forecast will produce a single forecast run in anticipation of the forecasting process on the Forecast Page.
For detailed information on each user function, check Enable Instructional Popups and roll over the element of interest.
MCMC Page
Forecast Page
Simulations on this page use the inputs from the optimization page until the time indicated by Forecast Onset. At that point the state of the model matches the fit achieved by the optimization.
Simulation following Forecast Onset uses the inputs from this page. After each optimization inputs on this page will be (re)set to values from the optimization page. The green values under the inputs display the optimization values. If an input is changed a green value under the input displays the optimization value. If the forecast value is a number, it turns red to indicate the change. If it is a switch, the green arrow underneath shows the change from optimization position.

|

|

|

|
The model Incidence and Mortality graphs will be red before Forecast Onset (showing the fit from optimization) and green after Forecast Onset, (showing the forecast using inputs from this page).
The Forecast Incidence and Forecast Mortaility graphs show the mean (μ), mean + 2 * standard deviation (μ+2*σ) and mean - 2 * standard deviation (μ-2*σ) over multiple runs, starting from Forecast Onset. The two tables contain μ and σ values for all simulation contact classes, and can be downloaded.
For detailed information on each user function, check Enable Instructional Popups and roll over the element of interest.
In Summary
To use this site:
- Settings Page:
- Create a project on the settings page by inputting Epidemic Parameters, Driver values, and Timing settings. Upload a CSV file containing incidence and mortality data for some span of days. Save the project and possibly the Epidemic and Driver settings for subsequent use. This creates a set of initial inputs that are transferred to the optimization page.
- Optimization Page:
- Run Nelder-Mead optimization to fit the simulation to the incidence and/or mortality curve(s). Selected Epidemic and/or Driver inputs are used in this optimization. The Nelder-Mead algorithm may be stopped before completed and continued. Stopping the algorithm and performing a single run allows you to check its progress. This creates a set of optimization inputs for use on the forecast page.
- Forecast Page:
- Sliders and switches on this page constitute forecast inputs, whose initial values are derived from the optimization inputs. Optimization values appear as small initially green values beneath the sliders. (Arrows are used to indicate optimization switch positions.) Changes to sliders and switches only affect the forecast inputs. When a forecast input differs from a optimization input, the green values turn red.
- During a simulation:
- From Time 0 until the Forecast Onset the simulation uses optimization settings. This is done so that the state of the simulation at the onset point matches its state at the end of the optimization fit.
- From the Forecast Onset until termination, the simulation uses forecast settings.
- An MCMC distribution file derived from the MCMC page may be uploaded. MCMC selection also takes place at Forecast Onset. Mean and standard deviation data is recorded in during simulation and may be downloaded.
For Additional Help ...
- Clicking Enable Instructional Popups on a page will provide popup instructions when you roll over the items on that page.
- Clicking Enable Instructional Popups on the home page enables the popups on all pages (they can subsequently be turned off on any specific page.)
- Click here for access to scientific manuscripts describing the model and videos showing it in action.
