Component Guide III: Displays and Controls
Numerus includes several different display and control components for displaying output and specifying input. These include Tables, Line Graphs, Scatter Charts, Bar Graphs and Histograms (display); and Sliders, Spinners and Toggles (control).
Features
- Adding a display or control
- Find the component in the Displays and Controls list on the left side of the design frame. Press and drag the component onto the design canvas and release the mouse.
- Continuous vs. Complete Plot
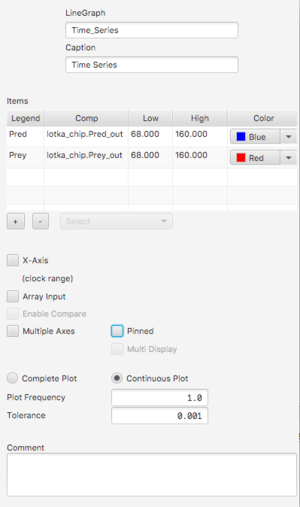
- All displays provide the option of Continuous Plot (data is displayed continuously throughout the simulation) or Complete Plot (data is only displayed at the end of the run). In the case of Continuous Plot, a Plot Frequency is also be specified. The Plot Frequency gives the number of time steps between plots.
- Pinning
- If a display/control appears in a submodel it is usually not included in the runtime canvas. However, if that submodel is used in a chip and pinning is selected, the component will be appear in the runtime canvas. If a display/control is used in an aggregator it will not be part of the runtime; the alternative is to use input and output pins to connect displays and controls to the aggregator's contents.
- Multi-controls
- If multiple instances of a chip is required with each instance having a unique input value, a multi-input control may be used instead of pinning the control and having individual control instances to accommodate all of the chip input. A multi-control is single control with a list containing all of the chips. To set the input for specific chip select that chip from the list and adjust the control accordingly. This approach avoids the clutter of too many input devices and organizes them by function.
Line Graph
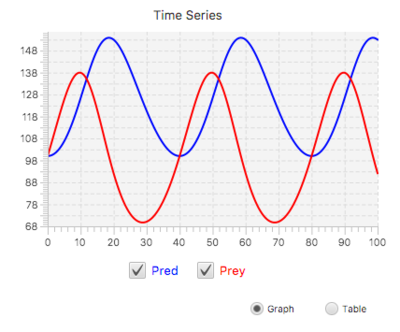
A Line Graph display is used to display results of a simulation over time. A Line Graph has the capability to display multiple series / variables simultaneously. You can also compare the results of different simulations on the same graph.
- Properties

