Graph Term
Overview
A Graph Term is a special type of Term in which values are determined by a function from the current time (or from the value of another term) to real values. Graph Terms allow you to incorporate real-world data into your models. You can import data in CSV form, use that data to build a function, then use the function in models you build in Numerus.
You create a Graph Term by selecting the Graph Function option on the Term properties panel, and then clicking on Edit Graph Function to specify the function.
Graph Function Edit Panel
A new Graph Function will open a panel with a function mapping all values to 0, as shown in Figure 1. Figure 2 shows an annotated Graph Term which is discussed below. (Click to enlarge). Functions can be defined either directly by clicking on the graph or entering data into the table of data points. Alternatively, a function can be defined by loading a CSV or TSV file.
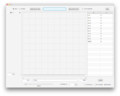
Figure 1: Empty Graph Term
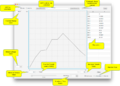
Figure 2: Annotated Graph Term

Features
| Function Domain | Initially set to TIME(); alternatively it can reference another Term to define a composed function. |
| Minimum/Maximum Domain Values | These should be kept at the start and end times of the simulation if TIME() is used for the domain. |
| Minimum/Maximum Range Values | Choose accordingly to best represent the graph. |
| Number of Data Points | Numerus will automatically partition the domain evenly for a function entered directly through the interface. |
| Function Type | Select from:
|
| Save CSV/TSV | A graph function constructed using the interface can be saved to a CSV or TSV file. The choice of delimiter depends on the choice of ".csv" or ".tsv" extension. The format depends on the choice or row or column orientation and is described below. |
Loading CSV/TSV Data
CSV/TSV data is loaded by clicking the Load CSV or TSV button and selecting a file for loading. The file must contain entries for both domain and range values. If the rows radio button is selected, the file is expected to contain 2 lines of delimited content, the first being the entries for the domain and the second for the range. If columns is selected, then each row should contain 2 entries (domain followed by range), with the number of lines corresponding to the number of data points. For example, considering the data in Figure 2, a row-oriented CSV file would look like this:
0,10.0,20.0,30.0,40.0,50.0,60.0,70.0,80.0,90.0,100.0
0,7.333,29.833,31.167,49.833,49.833,60.667,50.5,40.5,29.667,21.167
The equivalent column-oriented CSV file looks like this:
0.0,0
10.0,7.333
20.0,29.833
30.0,31.167
40.0,49.833
50.0,49.833
60.0,60.667
70.0,50.5
80.0,40.5
90.0,29.667
100.0,21.167
These formats are also applied when a CSV/TSV file is saved from data contained in the interface.
Note: if saving data from Excel or other programs for subsequent use in Numerus be sure to select CSV format and not CSV UTF-8, since the latter format is not readable by Numerus.
Load at Runtime: The CSV/TSV data used to create a Graph Function normally becomes part of the NovaScript code used during runtime. For large data files this will produce a very large NovaScript file. Alternatively, by selecting Load at Runtime, the data is not included in the NovaScript code and is loaded directly by the runtime simulation engine.
Graph Function Runtime Behavior
A Term defined by a Graph Function with a domain entry of TIME() will deliver the function's value at each time point during the simulation, interpolating or maintaining a step function as determined by the function type.
Alternatively, the domain entry may be an algebraic function of TIME() and/or other Terms. In this case the domain value is first computed at the current time. and then the corresponding function value returned.
Demo
The following video shows how to create, modify, save and reload a Graph Term.
<youtube>pkFvExxfSKw</youtube>